
Page 143 - SUSTAINABILITY REPORT 2016
P. 143
143
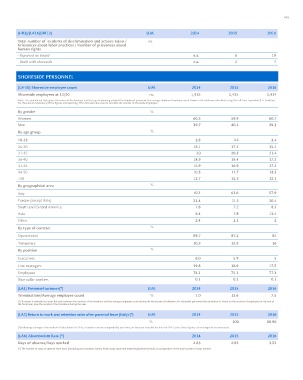
social Aspect - shiPBoArd PersoNNeL (hr3)/(LA16)(hr12) U.m. 2014 2015 2016
total number of incidents of discrimination and actions taken / no.
(g4-10) shipboard employee count U.m. 2014 2015 2016 w grievances about labor practices / Number of grievances about
human rights
Average shipboard employee count (*) no. 11,113 12,173 12,312
- Reported on board n.a. 6 19
(*) The data shown refers to the average number of employees currently embarked.
- Dealt with shoreside n.a. 2 7
Average number of employees in the shoreside reserve pool 6,616 6,549 6,467
(waiting to replace colleagues currently embarked)
By gender % shoreside PersoNNeL
Women 16.0 14.8 14.3
Men 84.0 85.2 85.7 (g4-10) shoreside employee count U.m. 2014 2015 2016
shoreside employees at 11/30 no. 1,415 1,435 1,414
By age group %
Note: It is pointed out that, given the nature of the business and the type of planning adopted for shipboard personnel, the average shipboard employee count shown in the table was calculated using the Full-Time Equivalent (FTE) method.
18-25 17.1 14.8 13.8 For the sake of consistency of the figures and reporting, FTE units were also used to calculate the number of shoreside employees.
26-30 29.1 30.1 30.1 By gender %
31-35 22.9 22.6 22.4 Women 60.3 59.9 60.7
36-40 14.8 15.1 15.1 Men 39.7 40.1 39.3
41-45 7.3 8.1 8.7
By age group %
46-50 4.0 4.2 4.5
>50 5.0 5.2 5.3 18-25 3.8 3.3 3.4
26-30 18.1 17.2 15.4
By geographical area %
31-35 20 20.3 21.4
Italy 12.9 12.3 12.0
36-40 18.9 18.4 17.3
Europe (except Italy) 3.9 3.8 3.5
41-45 15.9 16.9 17.2
South and Central America 11.5 12.6 11.9
46-50 10.5 11.7 13.3
Asia 71.6 71.2 72.5 >50 12.7 12.3 12.1
Other 0.1 0.1 0.1
By geographical area %
(LA1) turnover (*) U.m. 2014 2015 2016
Italy 62.1 61.6 57.9
terminations/Average employee count % 19 20(**) 20.15
Europe (except Italy) 21.4 21.3 20.4
(*) Turnover is intended to mean the ratio between the number of terminations and the average employee count during the fiscal year of reference; for shipboard personnel, the calculation is based on the average number of employees
currently embarked and those seafarers not embarked who are waiting to replace their colleagues on board. South and Central America 7.6 7.2 6.3
(**) Miscalculation in 2015.
Asia 6.4 7.8 13.4
(LA6) Numbers of injuries U.m. 2014 2015 2016
Other 2.4 2.1 2
total no. 1,104 1,013 1,006
By type of contract %
- Number of reportable injuries 779 617 618
Open-ended 89.7 87.2 84
- Other 325 396 388
Days off work (*) no. 3,007 2,269 6,429 Temporary 10.3 12.8 16
By position %
(*) There was a rise compared to the previous year in the number of hours of exemption assigned by the infirmary to the various cases and for this reason the index of gravity is higher (for the same number of accidents).
Index of frequency 3.56 2.57 2.51 Executives 6.0 5.9 5
Index of gravity 13.75 9.42 26.16 Line managers 19.8 18.9 17.5
Employees 74.1 75.1 77.3
(LA9) training (*) U.m. 2014 2015 2016
Blue collar workers 0.1 0.1 0.1
(*) The sum of the indicators differs from the total shown due to rounding up and down of the figures.
total hours of training no. 859,241 986,228 801,795 (LA1) Personnel turnover(*) U.m. 2014 2015 2016
- Environmental 105,621 112,240 55,718 terminations/Average employee count % 7.0 13.6 7.5
- Health 39,957 50,232 53,108 (*) Turnover is intended to mean the ratio between the number of terminations and the average employee count during the fiscal year of reference; for shoreside personnel the calculation is based on the number of employees at the end of
- Safety 264,262 241,328 95,882 the fiscal year, plus the number of terminations during the year.
- Security 119,950 30,809 28,616 (LA3) return to work and retention rates after parental leave (italy) (*) U.m. 2014 2015 2016
- Job skills 174,680 356,481 231,159 % - 100 88.90
- Language 41,831 35,610 24,517
(*) Following a change in the method of calculation for 2015, in order to ensure comparability over time, we have not included the data for 2014, since these figures can no longer be reconstructed.
- Managerial 14,080 39,988 36,285
(LA6) Absenteeism rate (*) 2014 2015 2016
- Orientation 71,234 92,533 252,605
- Train the trainer 1,858 3,348 2,373 days of absence/days worked 2.83 2.82 3.52
- Other 25,770 23,661 21,533 (*) The number of days of absence from work (excluding paid vacation, family leave, study leave and maternity/paternity leave) as a proportion of the total number of days worked.
hours per person no. 77.3 81 65.1