Page 32 - BILANCIO DI SOSTENIBILITÀ 2017 RISULTATI E PROSPETTIVE
P. 32

COMMITMENT   31


                                              Added Value                                38.4% for employees’ salaries,                                TOTAL ADDED VALUE                    11/30/2017                  11/30/2016                 11/30/2015
                                                                                                 wages and social contributions
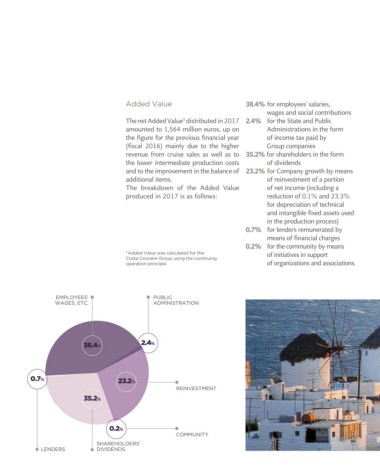
                                              The net Added Value  distributed in 2017   2.4%  for the State and Public                          A)    Value of production                       3,750,213,707.43           3,567,876,210.24           3,475,024,820.83
                                                                  3
                                              amounted to 1,564 million euros, up on             Administrations in the form
                                              the figure for the previous financial year         of income tax paid by                           1.    Revenues from sales and services          3,670,685,412.41           3,478,528,482.49           3,348,790,624.99
                                              (fiscal  2016)  mainly  due  to  the  higher       Group companies                                 4.    Other income                                 79,528,295.02              89,347,727.75            126,234,195.84
                                              revenue from cruise sales as well as to    35.2% for shareholders in the form                      Revenues from typical production                3,750,213,707.43           3,567,876,210.24           3,475,024,820.83
                                              the lower intermediate production costs            of dividends                                    B)   Intermediate production costs              2,190,759,030.40           2,017,727,378.67           2,086,631,528.80
                                              and to the improvement in the balance of   23.2%  for Company growth by means                      6.   Consumption of materials                     652,669,344.34             543,828,343.15            575,022,416.78
                                              additional items.                                  of reinvestment of a portion                    7.   Costs for services                         1,453,572,205.56           1,388,882,083.36          1,366,545,867.73
                                              The breakdown of the  Added  Value                 of net income (including a                      8.   Leases and rentals                            15,087,032.04              13,419,663.93             13,750,518.38
                                              produced in 2017 is as follows:                    reduction of 0.1% and 23.3%                     10.  Other accruals                                11,548,009.64               8,653,374.69              8,130,327.34
                                                                                                 for depreciation of technical
                                                                                                 and intangible fixed assets used                11.  Other operating charges                       57,882,438.82              62,943,913.54            123,182,398.57
                                                                                                 in the production process)                      CURRENT GROSS                                   1,559,454,677.03           1,550,148,831.57           1,406,701,963.77
                                                                                                                                                 ADDED VALUE
                                                                                                                                                              4
                                                                                         0.7%   for lenders remunerated by
                                                                                                 means of financial charges                      C - Additional and extraordinary items
                                                                                         0.2%  for the community by means                        12. +/- Balance of additional items                  4,732,400.58              4,696,569.16            -11,385,892.27
                                              3  Added Value was calculated for the              of initiatives in support                       Additional (revenues)/costs                          4,732,400.58              4,696,569.16            -11,385,892.27
                                              Costa Crociere Group using the continuing
                                              operation principle.                               of organizations and associations.
                                                                                                                                                           ADDED VALUE                     1,564,187,077.61            1,554,845,400.73           1,395,316,071.50


                                                                                                                                                4  Current gross added value includes extraordinary items, reclassified in accordance with the “Accounting Reform” introduced by Directive 2013/34/EU
                                                                                                                                                and transposed into Italian law by Legislative Decree no. 139/15. Balances for previous fiscal years have been reclassified based on the same principle.
                     EMPLOYEES’                         PUBLIC
                     WAGES, ETC.                        ADMINISTRATION


                                                    2.4%
                               38.4%


            0.7%
                                           23.2%
                                                                REINVESTMENT

                               35.2%


                                        0.2%
                                                                COMMUNITY
                                    SHAREHOLDERS’
                LENDERS             DIVIDENDS
   27   28   29   30   31   32   33   34   35   36   37