Page 22 - SUSTAINABILITY REPORT 2016
P. 22

GOVERNANCE  23


            2  Added Value was calculated for the   Added value                          The breakdown of Added Value is as
            Costa Crociere Group using the continuing                                    follows:                                                ToTAL ADDED VALUE                         11/30/2016                  11/30/2015                 11/30/2014
            operation principle.
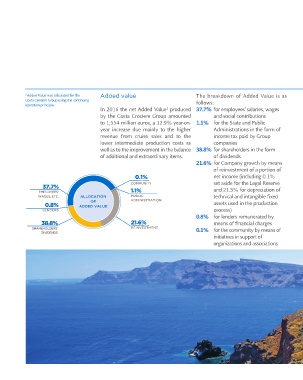
                                              In 2016 the net Added Value  produced      37.7% for employees’ salaries, wages
                                                                            2
                                              by the Costa Crociere Group amounted               and social contributions                        A - Value of production                         3,533,837,769.50          3,397,757,751.05           3,325,730,760.88
                                              to 1,554 million euros, a 12.9% year-on-   1.1%  for the State and Public                          1. Revenues from sales and services             3,478,528,482.49          3,348,790,624.99           3,262,399,781.86
                                              year increase due mainly to the higher             Administrations in the form of                  4. Other                                          55,309,287.01              48,967,126.06              63,330,979.62
                                              revenue from cruise sales and to the               income tax paid by Group                        revenues from typical production                3,533,837,769.50          3,397,757,751.05           3,325,730,761.48
                                              lower intermediate production costs as             companies                                       B - Intermediate production costs               1,983,606,367.36          1,991,055,787.28           2,024,042,246.91
                                              well as to the improvement in the balance   38.8%  for shareholders in the form                    6. Consumption of materials                      543,828,343.15             575,022,416.78             641,308,781.01
                                              of additional and extraordinary items.             of dividends                                    7. Costs for services                           1,388,882,083.36          1,366,545,867.73           1,290,165,102.01
                                                                                         21.6%  for Company growth by means                      8. Leases and rentals                             13,419,663.93               13,750,518.38             51,090,129.92
                                                                                                 of reinvestment of a portion of                 10. Other accruals                                 8,291,743.23                8,130,327.34              7,444,607.06
                                                              0.1%                               net income (including 0.1%                      11. Other operating charges                       29,184,533.69               27,606,657.05             34,033,626.91

                                                            COMMUNITY                            set aside for the Legal Reserve
                    37.7%                                                                        and 21.5% for depreciation of                   CUrrENT groSS                                   1,550,231,402.14          1,406,701,963.77           1,301,688,514.57
                  EMPLOYEES’                                1.1%                                                                                 ADDED VALUE
                  WAGES, ETC.        ALLOCATION             PUBLIC                               technical and intangible fi xed
                                          OF                ADMINISTRATION                       assets used in the production                   C - Additional and extraordinary items
                     0.8%            ADDED VALUE
                    LENDERS                                                                      process)                                        12. +/- Balance of additional items                4,696,569.16              -11,385,892.27                 46,992.63
                                                                                         0.8%   for lenders remunerated by                       Additional (revenues)/costs                        4,696,569.16              -11,385,892.27                 46,992.63
                    38.8%                                   21.6%                                means of fi nancial charges                     13. +/- Balance of extraordinary items               -978,917.93             -18,308,671.74              3,342,644.64
               SHAREHOLDERS’                                REINVESTMENT                 0.1%  for the community by means of
                   DIVIDENDS                                                                                                                     ADDED VALUE                                   1,553,949,053.37           1,377,007,399.76          1,305,078,151.84
                                                                                                 initiatives in support of
                                                                                                 organizations and associations
   17   18   19   20   21   22   23   24   25   26   27