
Page 137 - BILANCIO DI SOSTENIBILITÀ 2017 RISULTATI E PROSPETTIVE
P. 137
135
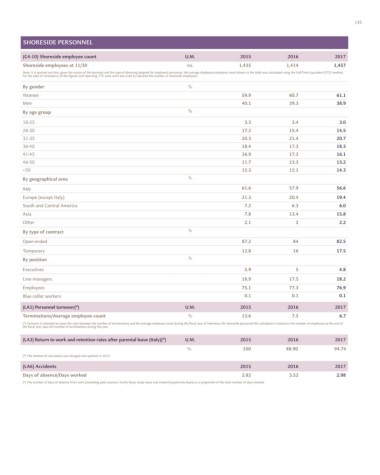
Social Aspect - SHIPBOARD PERSONNEL SHORESIDE PERSONNEL
(G4-10) Shipboard employee count U.M. 2015 2016 2017 (G4-10) Shoreside employee count U.M. 2015 2016 2017
Average shipboard employee count(*) no. 12,173 12,312 12,078 Shoreside employees at 11/30 no. 1,435 1,414 1,457
(*) The data shown refers to the average number of employees currently embarked. Note: It is pointed out that, given the nature of the business and the type of planning adopted for shipboard personnel, the average shipboard employee count shown in the table was calculated using the Full-Time Equivalent (FTE) method.
For the sake of consistency of the figures and reporting, FTE units were also used to calculate the number of shoreside employees.
Average number of employees in the shoreside reserve pool
(waiting to replace colleagues currently embarked) 6,549 6,467 7,108 By gender %
By gender % Women 59.9 60.7 61.1
Women 14.8 14.3 14.7 Men 40.1 39.3 38.9
Men 85.2 85.7 85.3 By age group %
By age group % 18-25 3.3 3.4 3.0
18-25 14.8 13.8 15.2 26-30 17.2 15.4 14.5
26-30 30.1 30.1 28.9 31-35 20.3 21.4 20.7
31-35 22.6 22.4 21.8 36-40 18.4 17.3 18.3
36-40 15.1 15.1 14.8 41-45 16.9 17.2 16.1
41-45 8.1 8.7 9.0 46-50 11.7 13.3 13.2
46-50 4.2 4.5 4.9 >50 12.3 12.1 14.3
>50 5.2 5.3 5.4
By geographical area %
By geographical area %
Italy 61.6 57.9 56.6
Italy 12.3 12.0 11.6
Europe (except Italy) 21.3 20.4 19.4
Europe (except Italy) 3.8 3.5 3.6
South and Central America 7.2 6.3 6.0
South and Central America 12.6 11.9 9.7
Asia 7.8 13.4 15.8
Asia 71.2 72.5 74.8
Other 0.1 0.1 0.3 Other 2.1 2 2.2
By type of contract %
(LA1) Turnover(*) U.M. 2015 2016 2017
Open-ended 87.2 84 82.5
Terminations / Average employee count % 20(**) 20.15 22.7
Temporary 12.8 16 17.5
(*) Turnover is intended to mean the ratio between the number of terminations and the average employee count during the fiscal year of reference; for shipboard personnel, the calculation is based on the average number of employees
currently embarked and those seafarers not embarked who are waiting to replace their colleagues on board. %
(**) Miscalculation in 2015. By position
(LA6) Number of injuries U.M. 2015 2016 2017 Executives 5.9 5 4.8
Total no. 1,013 1,006 1,139 Line managers 18.9 17.5 18.2
- Number of reportable injuries 617 618 715 Employees 75.1 77.3 76.9
- Other 396 388 424 Blue collar workers 0.1 0.1 0.1
Days off work (*) no. 2,269 6,429 2,081 (LA1) Personnel turnover(*) U.M. 2015 2016 2017
Index of frequency 2.57 2.51 2.91
Terminations/Average employee count % 13.6 7.5 6.7
Index of gravity 9.42 26.16 8.46
(*) Turnover is intended to mean the ratio between the number of terminations and the average employee count during the fiscal year of reference; for shoreside personnel the calculation is based on the number of employees at the end of
the fiscal year, plus the number of terminations during the year.
(LA9) Training(*) U.M. 2015 2016 2017
(*) The sum of the indicators differs from the total shown due to rounding up and down of the figures. (LA3) Return to work and retention rates after parental leave (Italy)(*) U.M. 2015 2016 2017
Total hours of training no. 986,228 801,795 1,066,087 % 100 88.90 94.74
- Environmental 112,240 55,718 57,447 (*) The method of calculation was changed and updated in 2015.
- Health 50,232 53,108 61,950 (LA6) Accidents 2015 2016 2017
- Safety 241,328 95,882 84,831
Days of absence/Days worked 2.82 3.52 2.98
- Security 30,809 28,616 30,293
(*) The number of days of absence from work (excluding paid vacation, family leave, study leave and maternity/paternity leave) as a proportion of the total number of days worked.
- Job skills 356,481 231,159 326,675
- Language 35,610 24,517 33,878
- Managerial 39,988 36,285 6,371
- Orientation 92,533 252,605 427,168
- Train the trainer 3,348 2,373 3,008
- Other 23,661 21,533 34,469
Hours per person no. 81 65.1 88.27