
Page 139 - BILANCIO DI SOSTENIBILITÀ 2017 RISULTATI E PROSPETTIVE
P. 139
137
(LA6) Accidents U.M. 2015 2016 2017 SUPPLY CHAIN
Total accidents no. 15 13 7
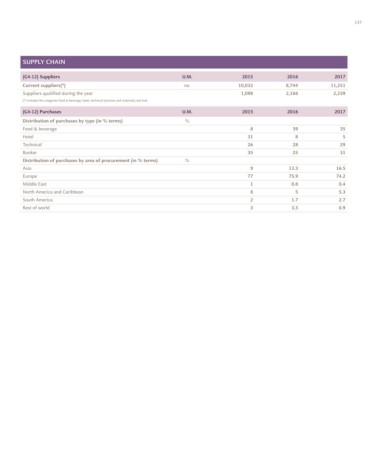
- In the workplace 4 6 3 (G4-12) Suppliers U.M. 2015 2016 2017
- Outside the workplace 11 7 4 Current suppliers(*) no. 10,032 8,744 11,251
Days off(*) no. 411 533 95 Suppliers qualified during the year 1,098 2,166 2,239
- Days of absence due to workplace injuries 54 217 55 (*) Includes the categories food & beverage, hotel, technical (services and materials) and fuel.
- Days of absence due to injuries outside workplace 357 316 40 (G4-12) Purchases U.M. 2015 2016 2017
Frequency index no. Distribution of purchases by type (in % terms) %
- for accidents at work 1.99 3.27 1.63 Food & beverage 8 39 35
- for accidents outside the workplace 5.46 3.82 2.18 Hotel 31 8 5
Severity index no. Technical 26 28 29
- for accidents at work 0.03 0.12 0.03 Bunker 35 25 31
- for accidents outside the workplace 0.18 0.17 0.02 Distribution of purchases by area of procurement (in % terms) %
(*) The number of days of absence from work (excluding paid vacation, family leave, study leave and maternity/paternity leave) as a proportion of the total number of days worked.
Asia 9 13.3 16.5
(LA9) Training(*) U.M. 2015 2016 2017 Europe 77 75.9 74.2
(*) The sum of the indicators differs from the total shown due to rounding up and down of the figures. Middle East 1 0.8 0.4
Total hours of training no. 30,891 23,688 33,068 North America and Caribbean 8 5 5.3
- Environmental 0 0 341 South America 2 1.7 2.7
- Health 824 0 2 Rest of world 3 3.3 0.9
- Safety 2,265 1,256 1,468
- Security 0 0 0
- Job skills 10,059 6,509 10,912
- Language 8,197 8,733 7,018
- Managerial 4,247 3,353 2,168
- Orientation 302 600 560
- Train the trainer 2,768 72 144
- Other 2,230 3,166 10,455
Hours per person no. 21.5 16.8 22.70
Total hours of shoreside and shipboard training per year no. 1,017,119 825,483 1,099,154
SHORESIDE AND SHIPBOARD PERSONNEL
(HR3)/(LA16)/(HR12) U.M. 2015 2016 2017
Total number of incidents of discrimination and actions taken / no.
Grievances about labor practices / Number of grievances about
human rights (via OBC Complaint)
- Reported on board 6 19 26
- Dealt with shoreside 2 7 2
(HR3)/(LA16)/(HR12) U.M. 2015 2016 2017
Total number of incidents of discrimination and actions taken /
Grievances about labor practices / Number of grievances about no.
human rights (via Carnival Corporation hotline)
- Reported ship and shore 41 41 77
- Wholly or partly confirmed 8 7 26