
Page 135 - BILANCIO DI SOSTENIBILITÀ 2017 RISULTATI E PROSPETTIVE
P. 135
133
Summary of indicators 2017
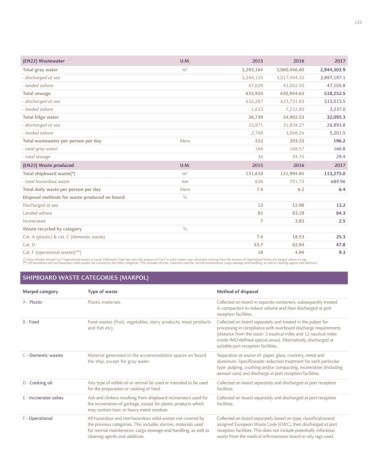
ENVIRONMENT ASPECT (EN22) Wastewater U.M. 2015 2016 2017
Total gray water m 3 3,293,164 3,060,446.60 2,944,302.9
(EN3) Energy consumption within the organization(*) U.M. 2015 2016 2017 - discharged at sea 3,246,135 3,017,444.10 2,897,197.1
(*) The sum of the indicators differs from the total shown due - landed ashore 47,029 43,002.50 47,105.8
to rounding up and down of the figures.
Total consumption(*) Gjoules 18,786,493 18,568,248.21 18,128,426.04 Total sewage 633,920 630,944.63 518,252.5
- shipboard 18,772,883 18,555,896.37 18,115,517.4 - discharged at sea 632,287 623,731.83 515,015.5
- shoreside 13,609 12,351.84 12,908.64 - landed ashore 1,633 7,212.80 3,237.0
Total fleet consumption MT 461,205 456,378.16 447,142.8 Total bilge water 36,739 34,902.53 32,095.3
- HFO 383,967 328,795.57 258,866.1 - discharged at sea 33,971 31,834.27 26,893.8
- LSFO 1,750 59,411.18 142,146.2 - landed ashore 2,768 3,068.26 5,201.5
- MGO 75,488 68,171.42 46,130.4 Total wastewater per person per day liters 222 203.33 196.2
(*) Conversion factors applied: fuel 1 TM=40.19 Gj; MGO 1 TM= 43.33 Gj - total gray water 186 168.57 166.8
(EN5) Pattern of fleetwide fuel consumption(*) U.M. 2015 2016 2017 - total sewage 36 34.75 29.4
Total shoreside consumption g/ALB-nm(**) 144.96 138.85 138.5 (EN23) Waste produced U.M. 2015 2016 2017
MT/kALBD(***) 35.5 35.06 (****) 34.7 Total shipboard waste(*) m 3 131,610 121,994.84 113,275.0
TOE 1,061.49 974.14 1,012.81 - total hazardous waste ton 836 701.73 689.96
(Tons of Oil Equivalent) Total daily waste per person per day liters 7.4 6.2 6.4
- heating 120.05 120.05 120.05 Disposal methods for waste produced on board %
- electricity 941.44 854.09 892.76225 Discharged at sea 12 12.98 13.2
(*) Data includes all current fleet, excluding from all years any ships transferred out to another brand or sold externally. Landed ashore 81 83.19 84.3
(**) ALB-nm stands for Available Lower Berth nautical miles: Available Lower Berth is a standard cruise industry metric of ship passenger capacity and refers to the number of guest beds available on a cruise ship, assuming two people occupy a cabin.
Combining this metric with distance travelled in nautical miles allows the incorporation of guests carried by the fleet as well as the fact that they are transported over distances. Data includes all current fleet, excluding any ships transferred out to another Incinerated 7 3.83 2.5
brand or sold externally.
(***) MT= metric tons of fuel consumed; ALBD = ALBDs (Available Lower Berth Days) is a standard measure of passenger capacity for the period, which the Company uses to perform rate and capacity variance analyses to determine the main non-
capacity driven factors that cause its cruise revenues and expenses to vary. ALBDs assume that each cabin the Company offers for sale accommodates two passengers and is computed by multiplying passenger capacity by revenueproducing ship Waste recycled by category %
operating days in the period.
(****) Updated by Finance for 2018 reporting. Cat. A (plastic) & cat. C (domestic waste) 7.4 18.53 25.3
(EN15) Total direct and indirect GHG U.M. 2015 2016 2017 Cat. D 53.7 62.94 47.8
emissions by weight Cat. F (operational waste)(**) 18 4.94 9.3
CO from fuel use ton 1,443,357 1,429,633.94 1,402,015.2
2 (*) Data includes Marpol Cat F (operational waste) as usual. Differently from last year, the amount of Cat F in cubic meters was calculated starting from the amount of Operational Waste discharged ashore (in kg).
CO from refrigerant releases 31,462 43,603.47 34,041.96 (**) All hazardous and non-hazardous solid wastes not covered by the other categories. This includes slurries, materials used for normal maintenance, cargo stowage and handling, as well as cleaning agents and additives.
2
(EN18) GHG emissions intensity U.M. 2015 2016 2017 SHIPBOARD WASTE CATEGORIES (MARPOL)
kg/ALB-km * 0.2465 0.2349 0.2344
( )
(*) ALB-km stands for Available Lower Berth kilometers: Available Lower Berth is a standard cruise industry metric of ship passenger capacity and refers to the number of guest beds available on a cruise ship, assuming two people occupy a cabin. Combining this metric with distance Marpol category Type of waste Method of disposal
travelled in kilometers allows the incorporation of guests carried by the fleet as well as the fact that they are transported over distances. Data includes all current fleet, excluding any ships transferred out to another brand or sold externally.
(EN20) Emissions of ozone-depleting substances(*) U.M. 2015 2016 2017 A - Plastic Plastic materials Collected on board in separate containers, subsequently treated
CFC-11 equivalent in compactors to reduce volume and then discharged at port
(*) The ODP (ozone depletion potential) conversion factors are those given in the Montreal kg 1.17 0.112 0.0 reception facilities.
Protocol Technical Papers.
B - Food Food wastes (fruit, vegetables, dairy products, meat products Collected on board separately and treated in the pulper for
(EN21) Air Emissions(*) 2015 2016 and fish etc). processing in compliance with overboard discharge requirements
NOx ton 29,978 29,664.58 34,969.4 (distance from the coast: 3 nautical miles and 12 nautical miles
SOx 18,360 17,334.10 16,248.4 inside IMO-defined special areas). Alternatively, discharged at
suitable port reception facilities.
Particulate (PM) 554 547.65 325.8
S
Specific emissions of NOx g/ALB-nm 9.4 9.03 10.89 C - Domestic wastes Material generated in the accommodation spaces on board Separation at source of: paper, glass, crockery, metal and
the ship, except for gray water. aluminum. Specificwaste reduction treatment for each particular
Specific emissions of SOx 5.8 5.27 4.91 type: pulping, crushing and/or compacting, incineration (including
Specific emissions of PM 0.174 0.167 0.08 aerosol cans) and discharge at port reception facilities.
(*) For the calculation of the volume of SOx, NOx and PMs the Company uses conversion factors laid down by Carnival Corporation for the evaluation of ship emissions. There are no GHG emissions standard metrics in the cruise line industry. With the aim of D - Cooking oil Any type of edible oil or animal fat used or intended to be used Collected on board separately and discharged at port reception
guaranteeing a system of control and management of the level of impact generated by each ship (from operating the diesel-electric and diesel power plants) the parent company has implemented measures based on existing International Maritime Organization
(IMO) regulations, including the voluntary introduction of a Ship Energy Efficiency Operational Indicator (EEOI) as a monitoring tool for managing passenger ship efficiency performance over time. for the preparation or cooking of food. facilities.
(EN8) Water withdrawal/consumption U.M. 2015 2016 2017 E - Incinerator ashes Ash and clinkers resulting from shipboard incinerators used for Collected on board separately and discharged at port reception
Total water withdrawal by source - shipboard m 3 3,927,084 4,099,526.65 3,910,834.9 the incineration of garbage, except for plastic products which facilities.
may contain toxic or heavy metal residues.
- Water supplied 1,252,843 1,394,345.50 1,178,171.0
- Water produced 2,763,565 2,729,211.20 2,794,050.1 F - Operational All hazardous and non-hazardous solid wastes not covered by Collected on board separately based on type, classificationand
the previous categories. This includes slurries, materials used
assigned European Waste Code (EWC), then discharged at port
Water consumed per person per day - shipboard(*) liters 221 226 221.6 for normal maintenance, cargo stowage and handling, as well as reception facilities. This does not include potentially infectious
(*) The calculation of the number of people on board per day was carried out by adding the number of passengers on board to the number of crew members (this is a set number for each ship) multiplied by the number of days in the year. cleaning agents and additives. waste from the medical infirmarieson board or oily rags used.
Water consumption in shoreside offices(**) m 3 11,302 11,600 11,600
(**) Including Savona cruise terminal